
We recently discussed why the uniaxial tensile test is one of the most useful material characterization tests available, and how to set up samples in the test for accurate results in our last blog. To get the most out of the test, it’s important to understand what is being measured. The uniaxial tensile test continuously measures the force required to elongate a test specimen by increasing increments until it fractures. Several notable material properties are found, such as the engineering stress and engineering strain, tensile strength, elastic modulus and offset yield strength. Most impactfully, it generates stress-strain curves, which are the unique identifiers of each material tested. Knowing these points of failure are critical when designing any component to make sure it will perform in harsh environments and under the use specified.
Engineering stress is instantaneous force divided by the original cross-sectional area of the test specimen. Engineering strain is the change in test specimen length divided by the original length, usually specified as a percentage. These are distinguished from the true stress and true strain, as discussed later. The next few paragraphs describe the engineering stress-strain curves.
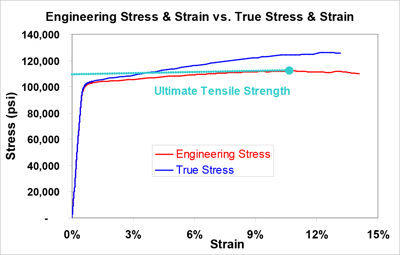
Figure 1. Example Chart of True and Engineering Stress-Strain Curves of Alloy 17410 HT
As the test proceeds, the force required to elongate the specimen increases linearly (for most materials) up to a point known as the proportional limit, as shown in green in Figure 2. The slope of the curve up to this point is known variously as the elastic modulus, Young’s modulus, or modulus of elasticity.
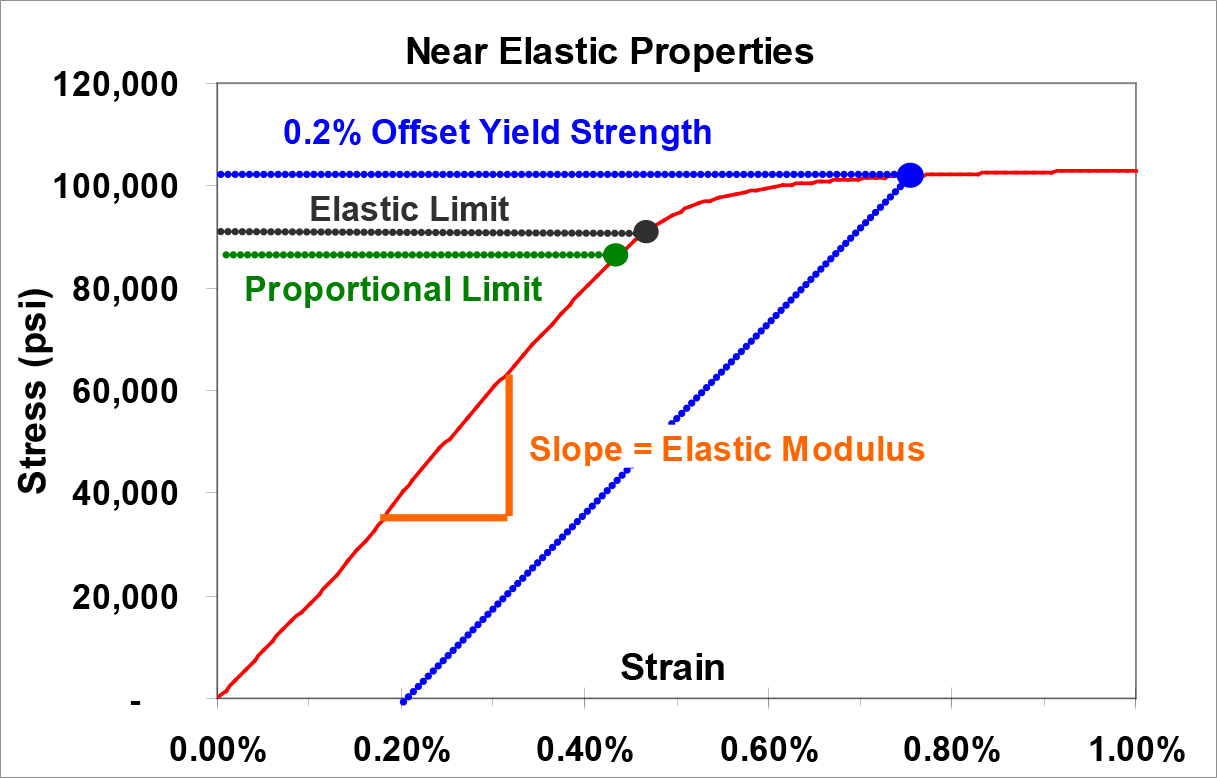
Figure 2. Stress-Strain Curve in the Near-Elastic Region
If you lightly strain (deform) an object, it will usually return to its original, undeformed shape when the load is removed. This is referred to as “elastic behavior”. If the stress is high enough, the object will permanently deform, called “plastic behavior”. The elastic limit on a stress-strain curve is the point where the behavior of the material switches from elastic to plastic. If the stress (and therefore strain) applied to a material is lower than the elastic limit, both the stress and strain will return to zero (recover) when the load is removed. If the elastic limit is exceeded, only the elastic strain will be recovered, and the plastic strain will remain as permanent set. The stress in the material will unload along a path parallel to the elastic modulus.
Usually, you would not want a component to remain deformed as permanent set. To avoid that, engineers attempt to design parts so that the expected service stress is less than the elastic limit by some reasonable factor of safety. The elastic limit cannot be accurately determined by a tensile test. Elastic limit is found using the much more time-consuming precision elastic limit test. However, it is easy to determine an offset yield strength from the stress-strain curve generated by a tensile test. For this reason, the yield strength of a material is specified more often than the elastic limit.
The yield strength is determined by finding the stress corresponding to a specified amount of permanent set, usually 0.2% strain for strip (or 0.5% extension under load for low-strength rod and wire). The 0.2% offset yield strength is found by drawing a line parallel to the elastic modulus from the 0.2% mark on the strain axis through its intercept with the stress-strain curve. (This is demonstrated by the dotted blue line in Figure 1 above.) Together, the yield strength, elastic limit and proportional limit are known as the near-elastic properties.
After the yield strength is exceeded, the stress-strain curve continues to rise to a maximum point known as the tensile strength or the ultimate tensile strength of the material. The strain up to this point is referred to as uniform strain because the deformation in the specimen is uniform. However, once the tensile strength is exceeded, the test specimen begins to thin down, or neck, at some location along the length. All the rest of the deformation to failure occurs at this point as the stress is concentrated in this area of reduced cross section.
As the engineering stress is determined by dividing the force load by the original cross-sectional area, the engineering stress-strain curve begins to slope downward at this point, even though the actual stress (the true stress) in the specimen continues to increase. The curve continues until the specimen breaks when the fracture stress is reached.
True stress is determined by dividing the load by the smallest actual minimum cross-sectional area of the specimen at any given time. The corresponding true strain at each point of the curve is computed by taking the natural logarithm of the ratio of the instantaneous length divided by the initial length. The true stress-strain curve continues to increase after the tensile strength is reached. Figure 1 above compares the engineering and true stress-strain curves for Alloy 174 HT copper-beryllium strip. The true stress-strain curves are more accurate and are used for simulation of material behavior in finite element analysis. However, they are more difficult to determine than engineering stress-strain curves because they require continuous measurement of the change in dimensions of the tensile specimen. For this reason, the easier to obtain engineering curves are used to generate the tensile properties that are specified on data sheets and industry standards.
Under uniform strain conditions (that is, up to the point of necking), the engineering and true stress and strain are related by the following equations:

The amount of energy required to fracture a material is known as its toughness. The area underneath the stress-strain curve up to any given point is a measure of the energy density required to strain the material to that point. Therefore, the total area underneath the stress-strain curve provides a measure of the toughness of the material.
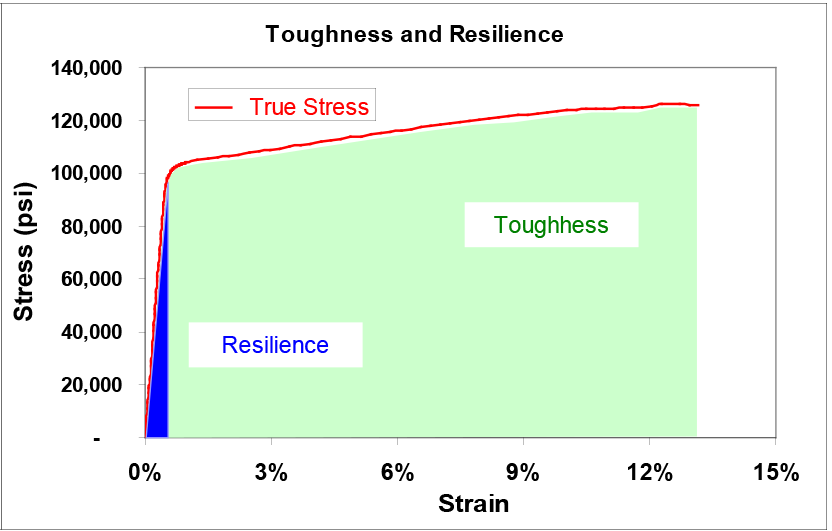
Figure 3. Toughness and Resilience
Elastic resilience is the amount of strain that a material can absorb without undergoing plastic deformation. It can be approximated by dividing the yield strength by the elastic modulus. Materials with high resilience can withstand greater amounts of deformation before yielding than materials with low resilience. The modulus of resilience is a measure of the strain energy density required to stress the material to the yield strength. It is the triangular area underneath the elastic portion of the stress-strain curve, as shown in Figure 3. It is approximated by taking the square of the yield strength and dividing by twice the elastic modulus.
The secant modulus at any point on the stress-strain curve is defined as the slope of the line from the origin to that point. Some materials do not show linear behavior in the elastic region of the stress-strain curve, so the secant modulus must be used in calculations instead of the elastic modulus. Fortunately, the copper-beryllium materials used in the tests done for the included figures show well-defined elastic modulus values.
The tangent modulus at any point on the curve is defined by ASTM as the instantaneous slope of the curve at that point. However, in finite element analysis (FEA), the tangent modulus takes on a somewhat different meaning. It is defined as the slope of the true stress-strain curve from the yield strength to the ultimate tensile strength. This allows the entire stress-strain curve to be mathematically approximated by two straight lines: the elastic modulus and the tangent modulus. This bilinear approximation works very well for copper-beryllium, since the elastic and plastic portions of their stress-strain curves are mostly linear. This can be seen in the example curve for Alloy 174 HT as shown in Figure 4.
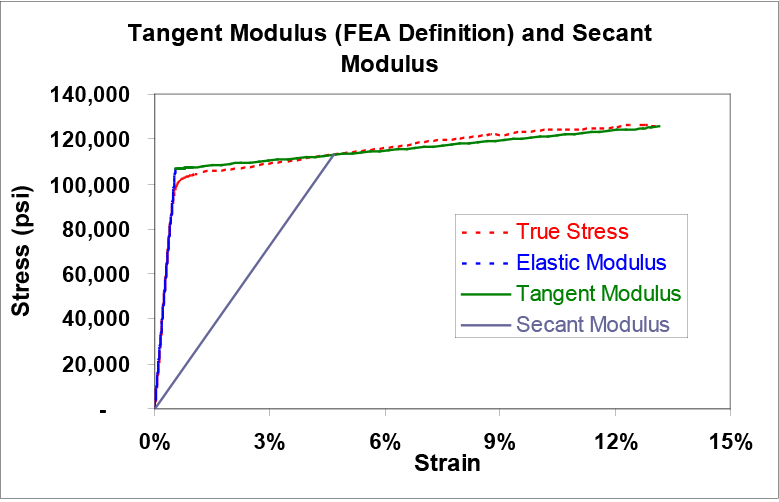
Figure 4. Tangent and Secant Moduli
Stress-strain curves are critical for understanding material behavior under varying loads. The mechanical properties revealed from these curves provides the data needed to make accurate material selections appropriate for the market application.
Learn more about material strain testing, see our related blogs: