Stress-strain curves are extremely important in understanding how materials perform – and how they fail. Material strain behavior can provide many significant indicators for how a component will hold up while in use. For example, the material used for an automobile’s exterior and safety features must be able to withstand strain to protect the people inside. Most components need to be able to withstand some level of strain and understanding stress strain curves will let us know how much.
Strain is a material response to applied stress, such as deformation. The strain hardening exponent characterizes how stress changes with instantaneous strain, and that exponent is associated with true strain. This is contrary to the strain rate sensitivity exponent, which is associated with strain rate. If the material displays different behaviors at varying strain rates, it has strain rate sensitivity.
Strain rate sensitivity shows us the tendency of a material to creep. If the rate is closer to zero, that material will have a lower tendency to creep, which is a tendency for a material to permanently deform while under stress. A higher strain rate sensitivity means that material has a stronger chance to deform when in the field.
However, not all deformation is undesirable, as some strain may cause increased strength through hardening. The equations for finding the strain rate sensitivity exponent and the strain rate hardening exponent appear to be similar, so it is critical to know the difference to determine how your material will react.
Below are the results of a tensile test, which demonstrates examples of stress-strain curves and what they mean. The engineering stress-strain curve rises linearly to the point of plastic deformation then increases more slowly as the material strain hardens until it reaches the ultimate tensile strength. Then it starts to fall off as the sample begins to neck down in thickness. (This elongation after necking is called non-uniform elongation.) The true stress-strain curve rises continuously to the point of fracture.
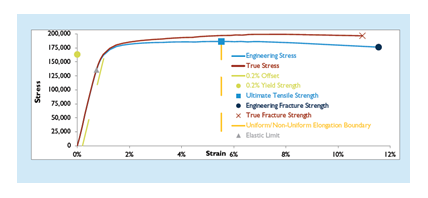
Figure 1. Engineering and True Stress-Strain Curves
Once strain hardening begins, the true stress-strain curve is always higher than the engineering stress-strain curve. This is because the instantaneous cross section after yielding is always smaller than the original cross section.
Furthermore, if you plot the true stress-strain curve on log-log coordinates, you can generate a numerical expression for the strain hardening, as shown in Figure 2. The coefficients are the strain hardening coefficient (K) and the strain hardening exponent (n). This exponent is a measure of how the stress changes with the instantaneous strain.
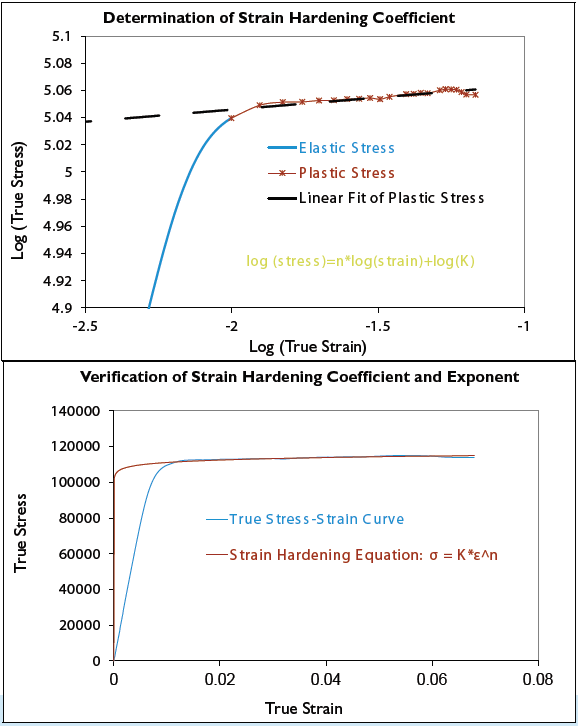
Figure 2. Strain Hardening Behavior of a High-strength Copper Alloy
Note that the linear fit of the plastic strain region on the log-log scale in Figure 2 is very good. It is easy to calculate the strain hardening coefficient and exponent. However, the fit in the elastic region and in the knee of the curve is not so good. This is why the full, true stress-strain curve, or even a bilinear approximation of it, is preferred for finite element analysis.
During plastic deformation, the stress level that is required to keep the deformation continuing is called the flow stress. This property is typically measured in a compression test, unlike most other properties associated with strain hardening, which are measured in tension. The sample is usually cylindrical with an aspect ratio of 3:2, as shown in Figure 3. Multiple flow stress tests are typically run on a material to quantify deformability of the material, usually at different strain rates and at different temperatures.
In this case, the results of the flow stress test illustrate that the peak stress is higher as the strain increases. If the material shows different behaviors at different strain rates, it is said to have strain rate sensitivity. Like the strain rate exponent (n) governs the slope of the stress-strain curve at a given strain, the strain rate sensitivity exponent (m), also known as the strain rate hardening exponent, governs the slope of the stress strain-curve at a given strain rate. This means that the n exponent is a function of strain rate, and is therefore not a constant, unless m=0.
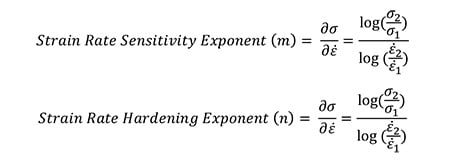
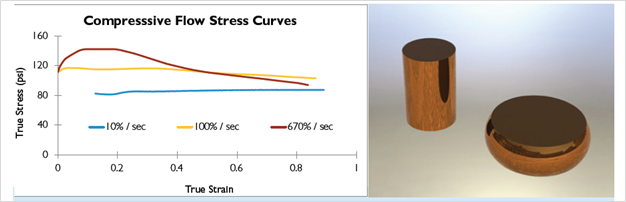
Figure 3. Compressive Flow Stress Curve of a Copper Alloy (left) and Representative Samples Before and After Testing
Note in Figure 3 that as the strain rate increases, it takes a higher amount of flow stress to continue deforming the material. This means that the material effectively has a higher strength when the deformation is faster.
The strain rate sensitivity exponent governs how a material deforms. If the exponent is positive, then tensile properties such as yield strength, tensile strength, percent elongation and reduction of area increase as strain rate increases. The material can better spread the deformation associated with necking, leading to greater non-uniform elongation and improved formability. Since all these effects result in more area under the stress-strain curve, toughness improves as well. A negative exponent will result in forming difficulties, as the material will be unable to spread the non-uniform deformation and failure will begin immediately at the point of necking.
As an aside, in slow strain rate testing (SSRT), a tensile sample is pulled to failure at a very low strain rate in an environment known to promote stress corrosion cracking or hydrogen embrittlement in the particular material tested. The slow strain rate is not chosen for its effect on the mechanical properties of the material, but rather for its tendency to encourage stress corrosion cracking of the material in the test environment. Nevertheless, the measured ductility of the specimens at failure is usually directly proportional to the strain rate.
Thanks for joining us for another edition of In Our Element. For ongoing industry updates, connect with us on LinkedIn.